

Maven AI: Talk to your data
Maven AI is Usermaven’s built-in AI that lets you ask questions about your data in plain language and get instant answers, charts, and insights, no SQL or query building required. You can also set up Maven AI Agents — scheduled investigators that pursue an objective on their own and report back what they find.
Beyond answering questions, Maven AI can build things for you, from individual charts to complete dashboards.
What Maven AI can do
Maven AI connects directly to your workspace data and helps you understand what’s happening across your product and marketing. Instead of navigating multiple dashboards to piece together an answer, you simply ask a question.
Beyond answering questions, Maven AI can build things for you, from individual charts to full dashboards.
Key things Maven AI can do:
Answer questions in plain language — ask about any metric and get an instant answer with charts and numbers.
Build dashboards — describe the dashboard you want and Maven builds it for you, filling tiles live as it works.
Create trends — ask for a trend over time (for example, "Show me the new signups trend over the last 6 months") and get a chart.
Build funnels — find out where users drop off in a funnel you define.
Create attribution & retention analyses — build attribution and retention tiles end to end using the analytics authoring tools.
Generate reports — create analytics reports and explore them in a conversation.
Maven AI Agents
Maven AI Agents take the same data and tools Maven AI uses in a chat and put them to work on a schedule. An agent is an autonomous analytics investigator: you give it an objective, and it runs on its own, pursues that objective against your workspace data, and reports what it found.
Because agents run without you in the loop, they work with read-only analytics tools. An agent cannot send messages, change your data, or ask a person to respond while it is running — it investigates and reports.
What you set on an agent:
Objective — the goal the agent should pursue on every run. For example: "Find trial accounts that need help getting started."
Scope and focus — which part of your data to look at, and what the agent should prioritize in its answer.
Definition — the business definition Maven needs to read your data correctly, such as which tracked event means an account has activated. If an essential definition is missing, the agent asks for it instead of guessing.
Schedule — daily, weekdays, or weekly, at the hour and timezone you choose.
Delivery — where the report goes: inside Maven, to email recipients, or to a Slack channel.
Notifications — tell you only about noteworthy findings, or after every run.
Starting from a template
You don’t have to write the objective from scratch. When you create an agent, Maven offers ready-made templates, including:
Activation check — trial accounts that need help getting started
Weekly growth review — acquisition, activation, and retention in one report
Expansion opportunities — accounts whose product adoption is growing
Retention risk — accounts whose usage dropped week over week
Traffic and acquisition — shifts in sources, channels, and campaigns
Conversion funnel check — drop-offs in your key funnels and goals
Feature adoption — which features gain or lose usage
Content performance — pages that are rising, falling, or converting
Campaign watch — how marketing campaigns perform after launch
Each template comes with a suggested objective, scope, and schedule. You can review and edit everything before you turn the agent on.
Agent runs and insights
Insights — every finding an agent reports lands in the Insights tab, so you can catch up on what Maven found without opening each run.
Run reports — each run produces a report showing what the agent checked, the evidence behind each finding, and what to look at next.
Pause and resume — pause an agent to stop future scheduled runs; a run already in progress finishes. Resume it whenever you want.
Permissions — an agent runs with the workspace permissions of the user who created it, and sending results to email or Slack requires permission to share Maven results.
The data Maven AI works with
Maven AI reads from your workspace across the full set of product and website analytics data, including:
Website Analytics — traffic, top pages, sources, locations, and audience behavior.
Attribution — which marketing channels are driving conversions and the customer journey.
Paid Ads Attribution — ROAS and performance across paid ad campaigns.
Trends — changes in a metric over time.
Funnels — step-by-step conversion and drop-off.
Engagement & Retention — who your most engaged and retained users are, and power-user behavior.
Getting started
Maven AI lives in the main navigation of your workspace. Click Maven AI in the left sidebar to open it. The Maven AI area has three tabs: Chats for your conversations, Insights for findings your agents have reported, and Agents for creating and managing agents.
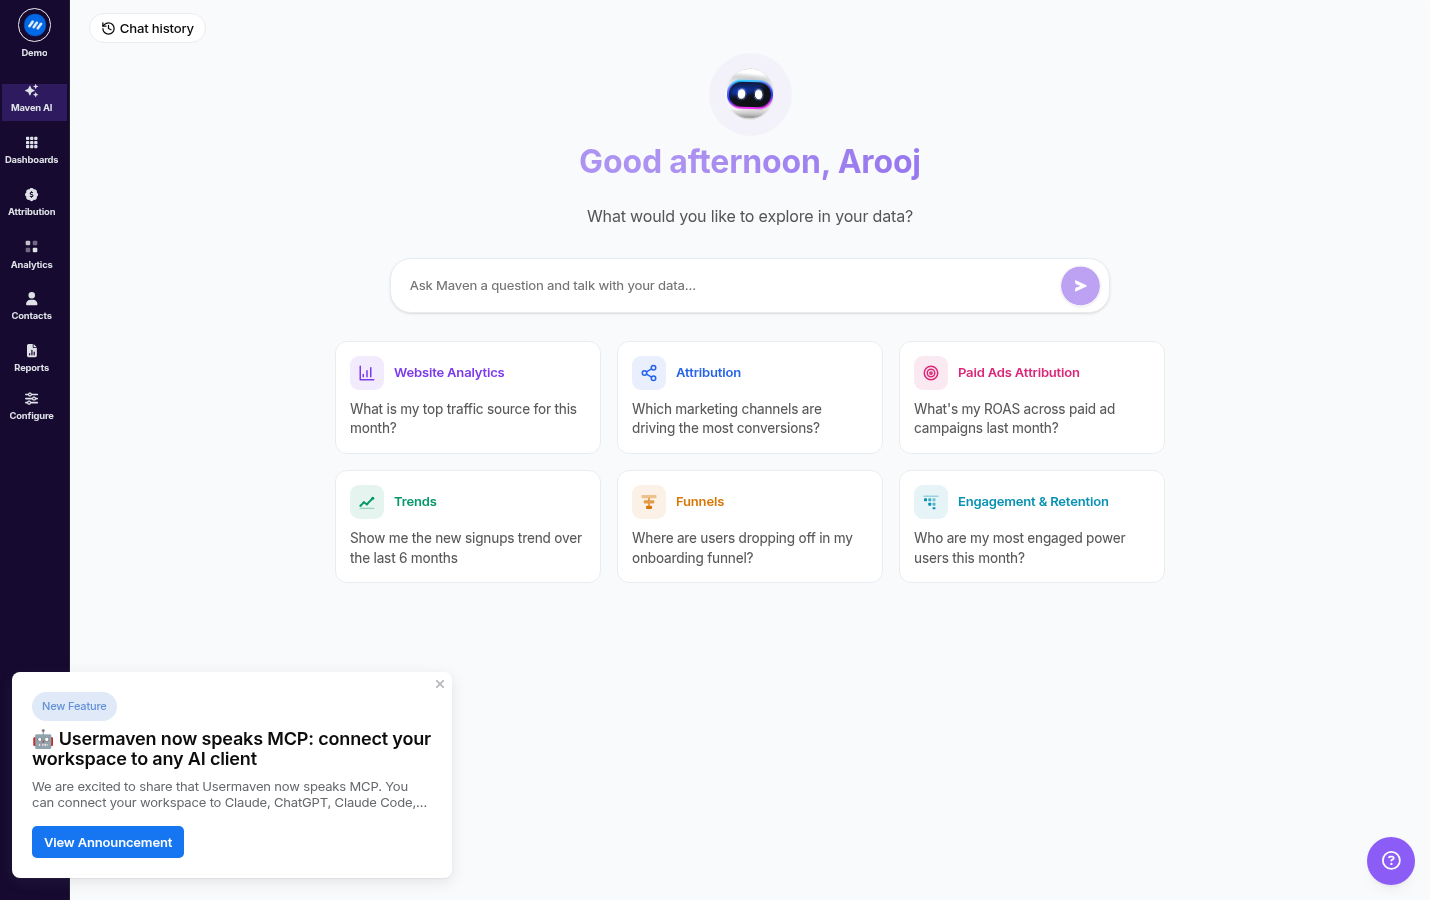
When you open Maven AI for the first time, you’ll see a clean chat screen with suggested prompts to help you get started.
You can click any suggested question, or type your own question in the text box and press Send.
Asking a question
To ask a question:
Open Maven AI from the left navigation.
Click a suggested prompt or type your question into the "Ask Maven a question and talk with your data..." field.
Press Send.
Maven AI will analyze your data and return an answer with relevant charts and numbers.
You can refine your question in a follow-up message, just like a conversation.
Building a dashboard with Maven AI
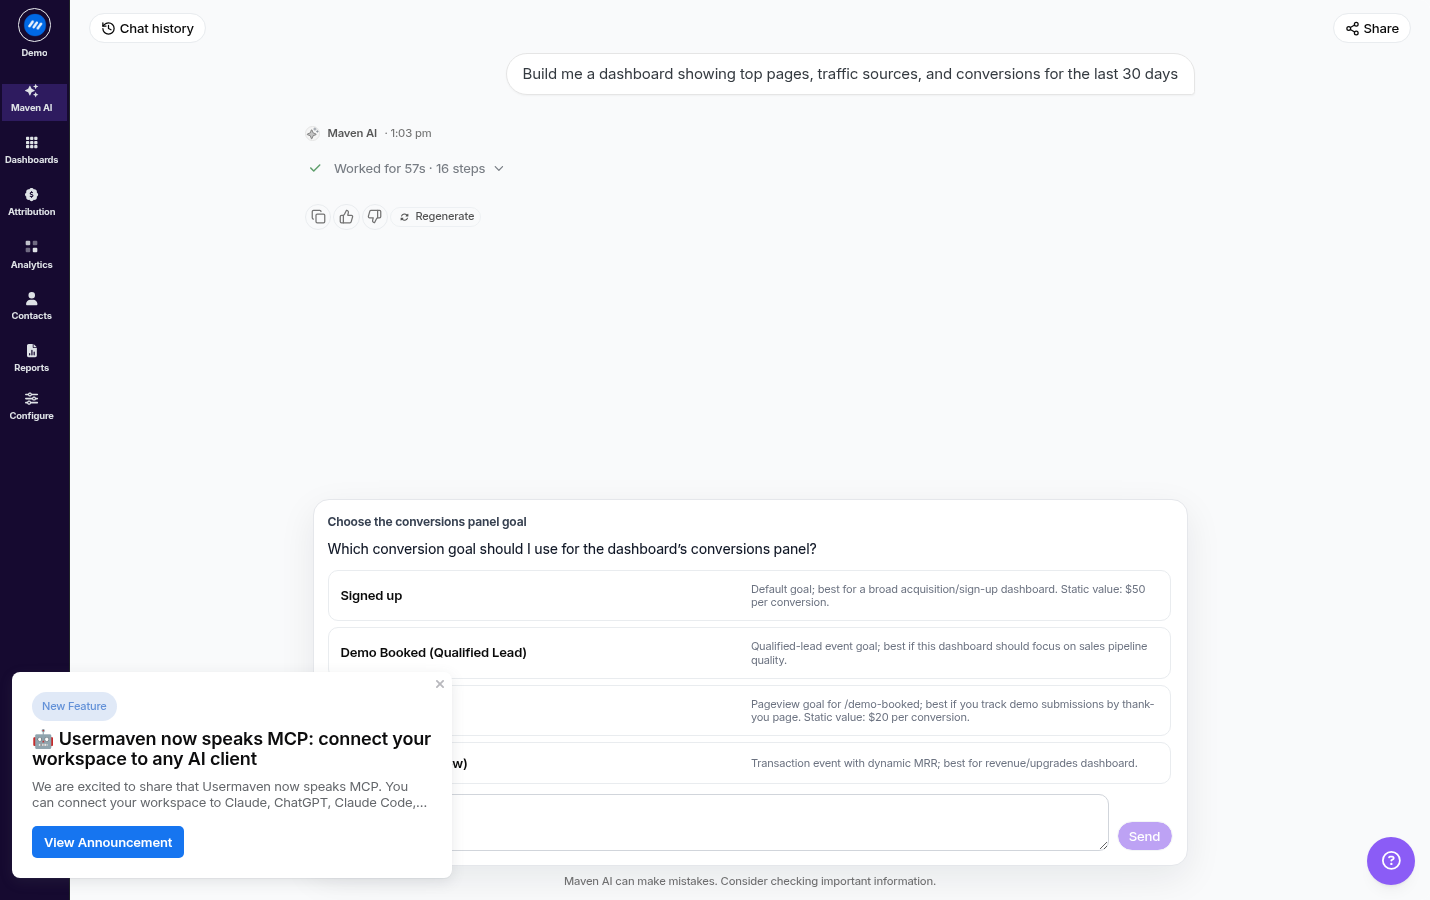
You can ask Maven AI to build a dashboard for you. For example: "Build me a dashboard showing top pages, traffic sources, and conversions for the last 30 days."
When you do, Maven:
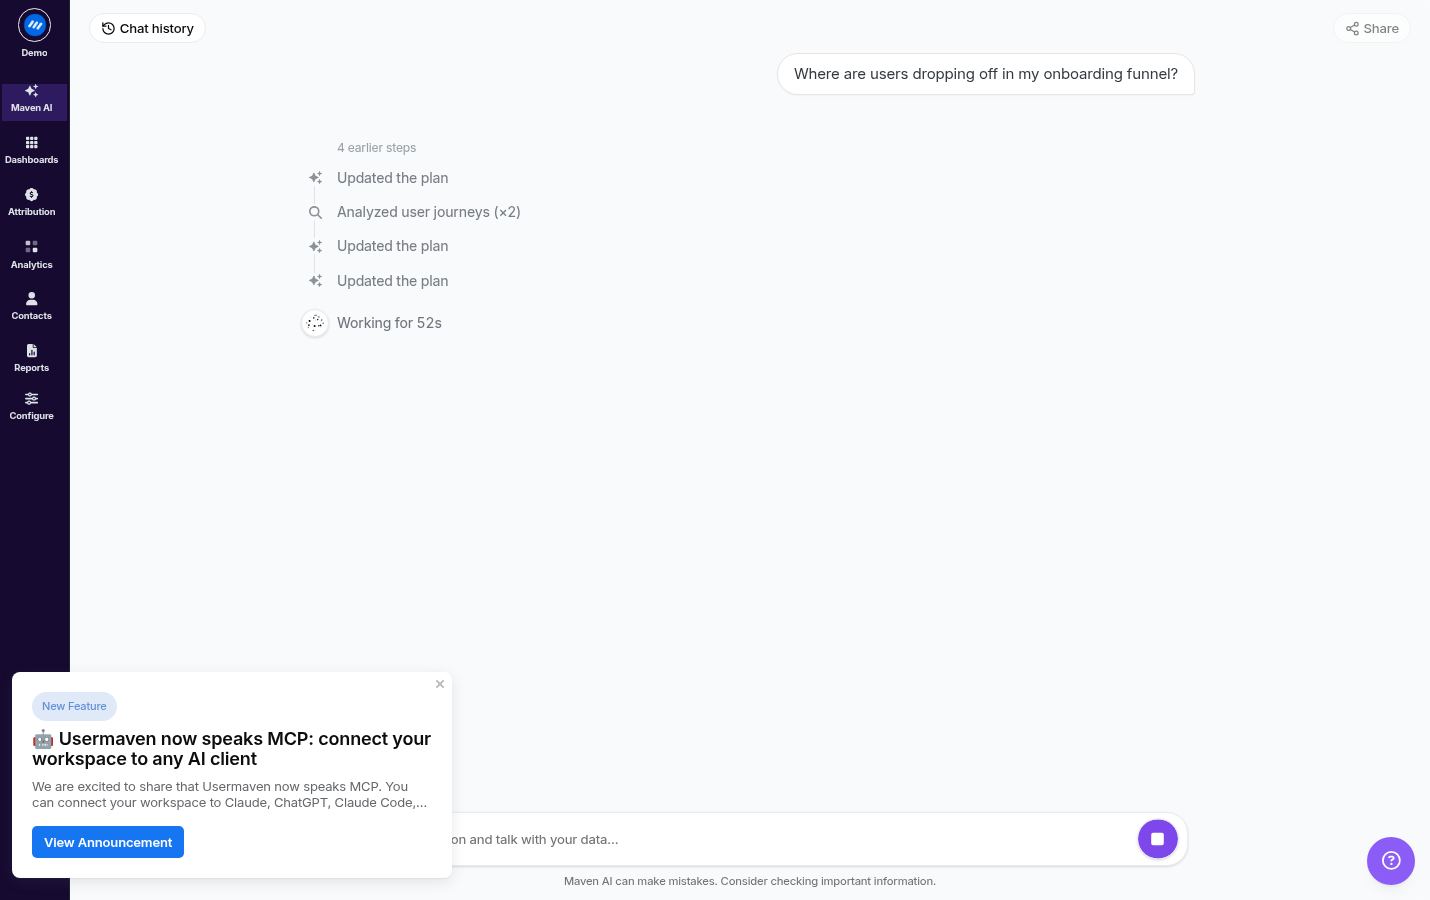
Works through the build as an agent — it may take multiple steps (for example, working across 15+ steps to assemble the board).
Asks clarifying questions where needed — such as which conversion goal to use (e.g., Signed up, Demo Booked, Plan upgraded), so the dashboard fits your business.
Fills tiles live as it works — the dashboard takes shape in real time.
Lets you review, regenerate, or rate the result — you can copy the response, mark it good or bad, or regenerate.
Creating trends and analyses
With Maven AI you can create and explore analytics interactively:
Trends — ask for a metric over time, like new signups over the last 6 months, and Maven returns the chart.
Funnels — describe your funnel and Maven shows where users are dropping off.
Attribution and retention — ask Maven to build attribution or retention views and it uses the analytics authoring tools to create them.
Managing your conversations
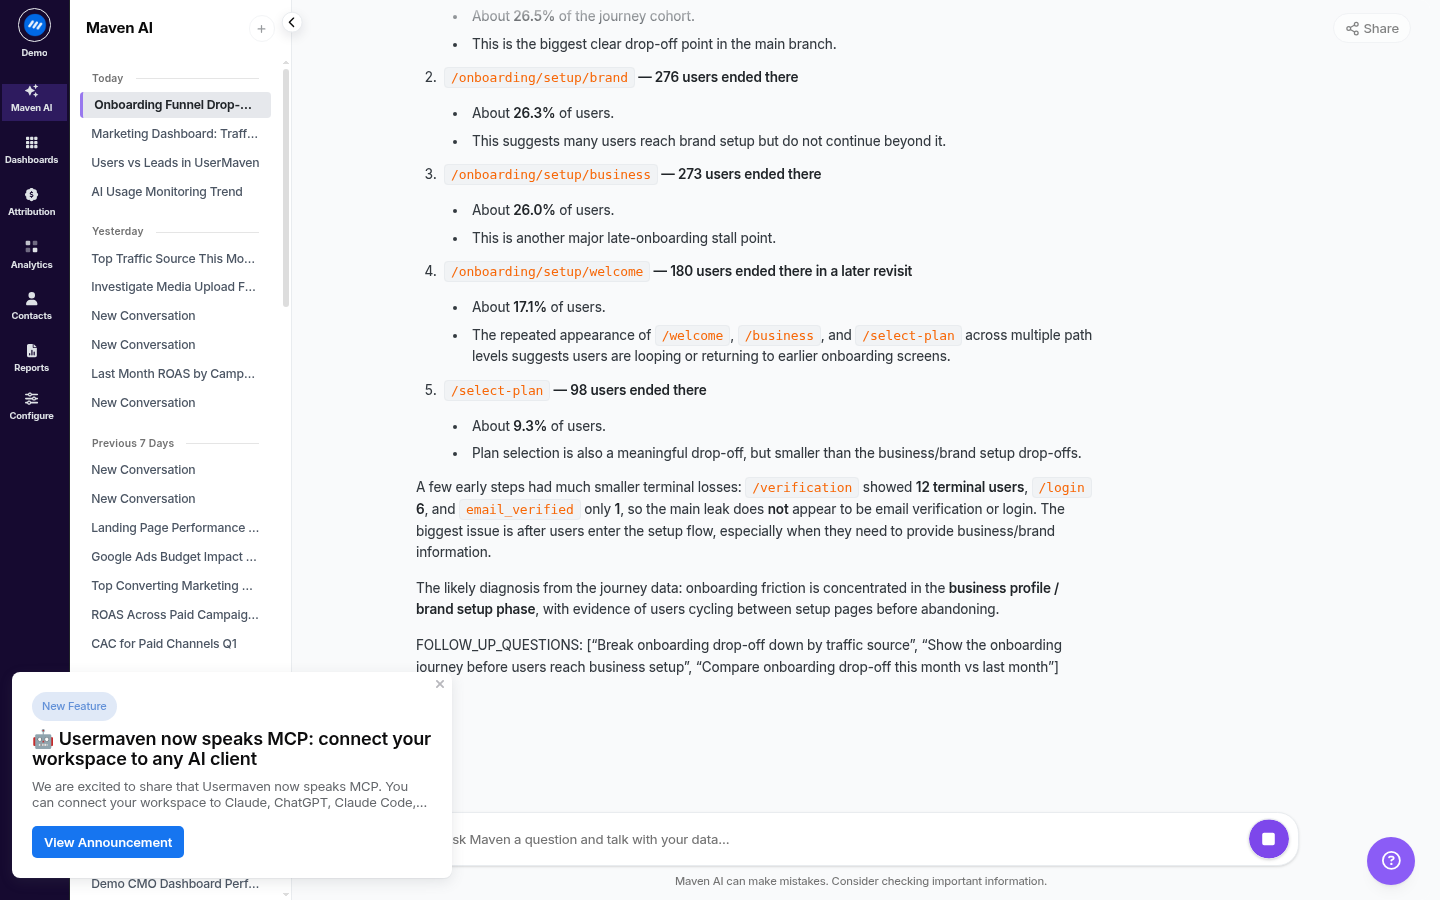
Every conversation with Maven AI is saved so you can return to it later.
Use the Chat history button to open a list of your previous conversations and pick up where you left off. You can also start a new chat at any time.
Tips for better answers
Be specific about the metric and time range you care about (for example, "signups in the last 30 days").
To get a dashboard built, ask Maven to build one and describe what tiles you’d like.
Mention the product area you’re asking about, such as Website Analytics, Attribution, Funnels, or Trends.
Ask follow-up questions to drill into a chart or number you find interesting.
Was this article helpful?